


How Infohub Works
Learn how you can standardize the processing, storage, and distribution of the information that helps you run your operation.
Empowering World Leading Operations For Over A Decade






Follow Our 5 Step Process
To Get Your Data Decision-Ready
Build Your Information Model
Trusted information starts with a shared model for how data should be defined, organized, and used.
Define the rules for how raw data becomes useful information. Set the events, time periods, calculations, and context your teams care about so KPIs and operational insights are created consistently.
Connect Your Data
All your operational data in one place. Step Two is about connecting the systems your operations run on.

Infohub connects to historians, databases, and industrial systems so data from across your operations is available in one place.
This unified data foundation allows the information model to consistently transform raw data into the KPIs, events, and operational insights your teams depend on.
Transform Data Into Information
Working continuously in the background. Step Three executes your information model to produce trusted operational information.

Infohub continuously executes the rules defined in your information model and stores the results.
KPIs, events, and operational metrics are calculated automatically so trusted information is always available and ready to use without engineers rebuilding the same logic across reports, spreadsheets, and applications.
Visualize Operational Information
Explore your operational information through dashboards, charts, and reports so teams can quickly understand what is happening.

Because Infohub already produces trusted KPIs, events, and operational metrics, building dashboards becomes simple.
Teams can quickly create visualizations that monitor performance, investigate issues, and support better decisions.
Share Information Across Systems
Publish trusted operational information to the systems and platforms your organization already uses.

Tiered Servers

REST API

AWS

Snowflake

Azure Event Hub

MySQL

PostgreSQL

MSSQL

MQTT

MQTT Sparkplug

Kafka

Canary Historian


Microsoft Teams

Slack

Plus many more
Infohub makes it easy to securely publish KPIs, events, and operational information to other systems, data platforms, and applications. Whether feeding cloud analytics platforms, operational tools, or messaging systems, your information flows from a single-source-of-truth.
Turn Data Into Decisions
In 5 Simple Steps
Industrial Data Management
Made Simple
An industrial data management (IDM) solution collects, organizes, and contextualizes operational and enterprise data to ensure accuracy, accessibility, and usability for analytics, decision-making, and automation.
InfoHub was built to make it easy for you to control your data and engineering governance, bring your varied data sources together, and ensure that the information you need is reliably transformed and distributed. InfoHub is IDM made easy!

No/Low-Code
Flow's InfoHub provides a structured, no/low-code approach to extend and refine projects without rewriting logic or disrupting existing models.

Platform Agnostic
Avoid vendor lock and ensure your data can flow freely. Flow stays independent of the SCADA and historian layer, and works with any data lake or cloud tooling.

OT/IT Convergence
Standardized data models, scalable architectures, and interoperability between traditionally siloed systems, enabling better decision-making.

Step 1: Model


Step 3: Transform

Step 4: Visualize

Step 5: Bridge
"We unified our data sources, our data treatments, and our data experts. Then we sent context rich information to our data warehouse."
Step 1: Model
Define How You Create, Manage
And Distribute Information
An information model defines the key data an organization focuses on and establishes governance for how that data is created, managed, and used.
The model contains the business rules for how data is transformed into useful information and then distributed.

Flexible Structure
Follow standards like ISA-95 or use your own structure. The model is yours to define.

Measures & Events
Identify process and calendar events, and determine how KPI measures are aggregated.

Templatized
Using a template-first approach ensures you can easily scale and manage your solution.

Step 2: Connect
Unify Your Systems Regardless
of Platform or Technology
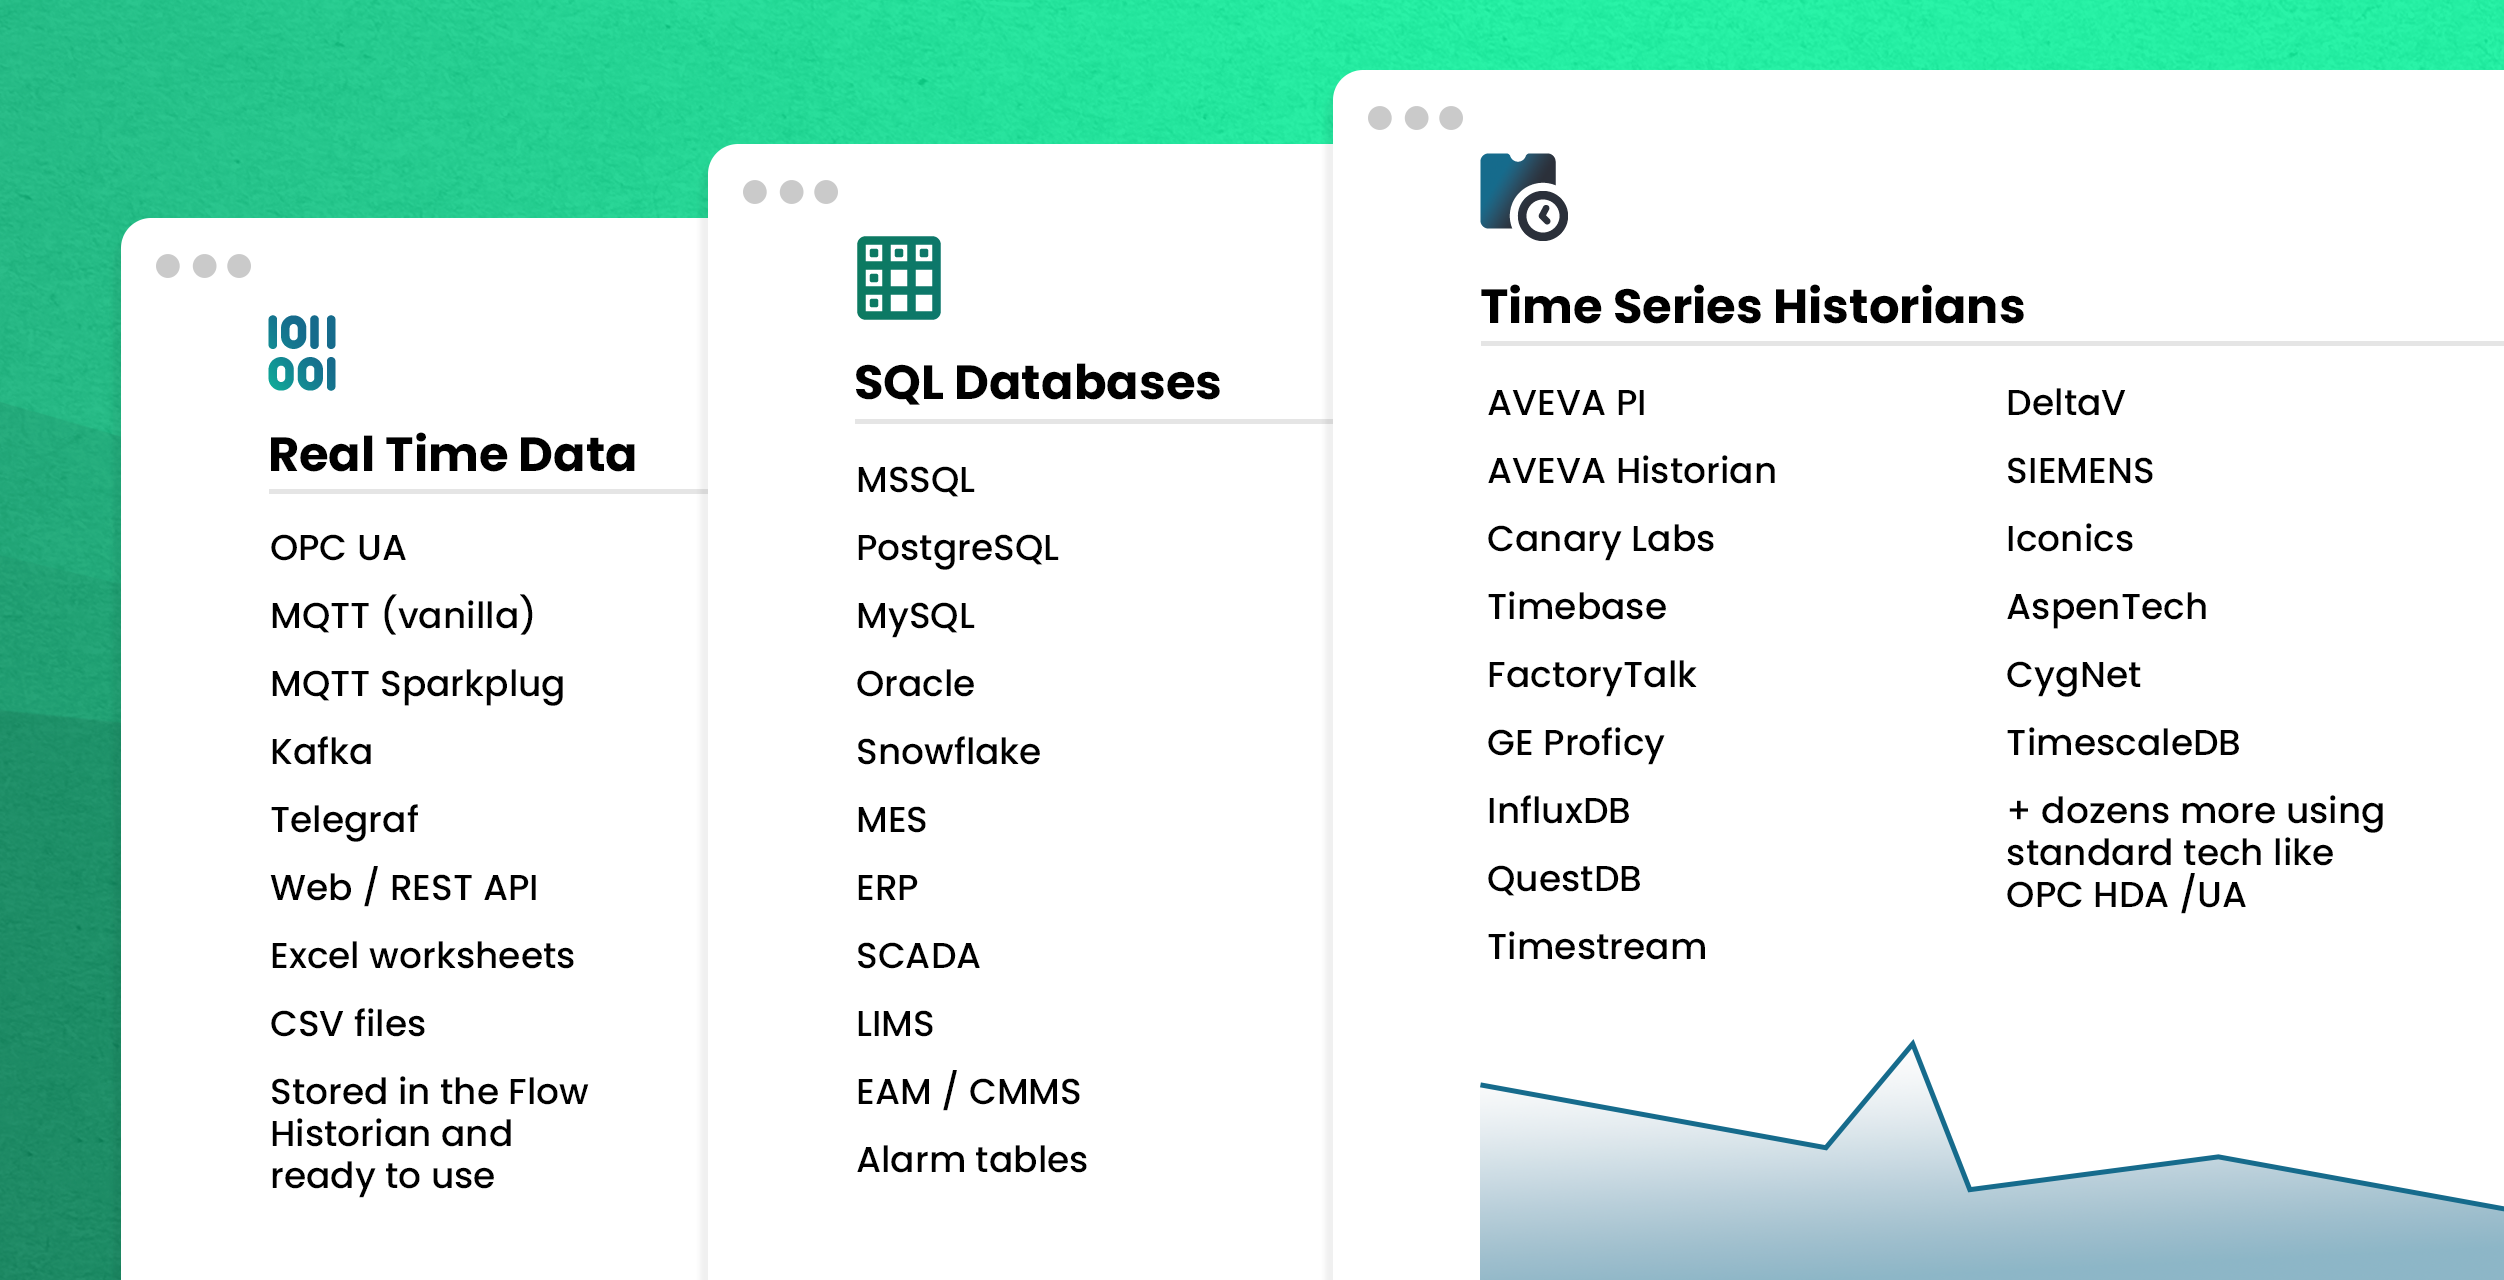
Make it possible for your engineers and managers to work with data from across many systems in one centralized location. Every Information Hub system includes data connectors so you can easily connect to historians, SQL databases, OPC servers, MQTT brokers, cloud solutions, and more.

Enterprise
Cloud applications and databases can connect too!
Site & Legacy
Unite your manufacturing systems in one view.

Open Source
Connect to the latest and greatest open source databases.
Need a Data Historian? Try Ours FREE!

The First Completely FREE Data Historian With No Strings Attached!
We built Timebase's Time Series Data Historian, to ensure you have unrestricted access to your time series data. You heard that right, a completely free data historian just for manufacturing!
It's free because manufacturers deserve a reliable data historian, great trending, and open data access at their fingertips. Download a copy and learn more at www.timebase.com.
Step 3: Transform
Transform Your Raw Data Into A
Richly Contextualized Narrative
Flow Software includes a suite of powerful engines designed to execute the business rules established in the Information Model, ensuring that data processing is consistent, efficient, and aligned with organizational goals. This integration allows for precise data management and effective decision-making.

Data Engine
Purpose built to address the unique challenges of manufacturing.

Recalc As Needed
When underlying data changes, all calcs and their dependents automatically rerun.

Version History
No values are ever discarded, allowing a full version history of any previous records.

Step 4: Visualize
Dashboards That Build trust are
key to confident decision making
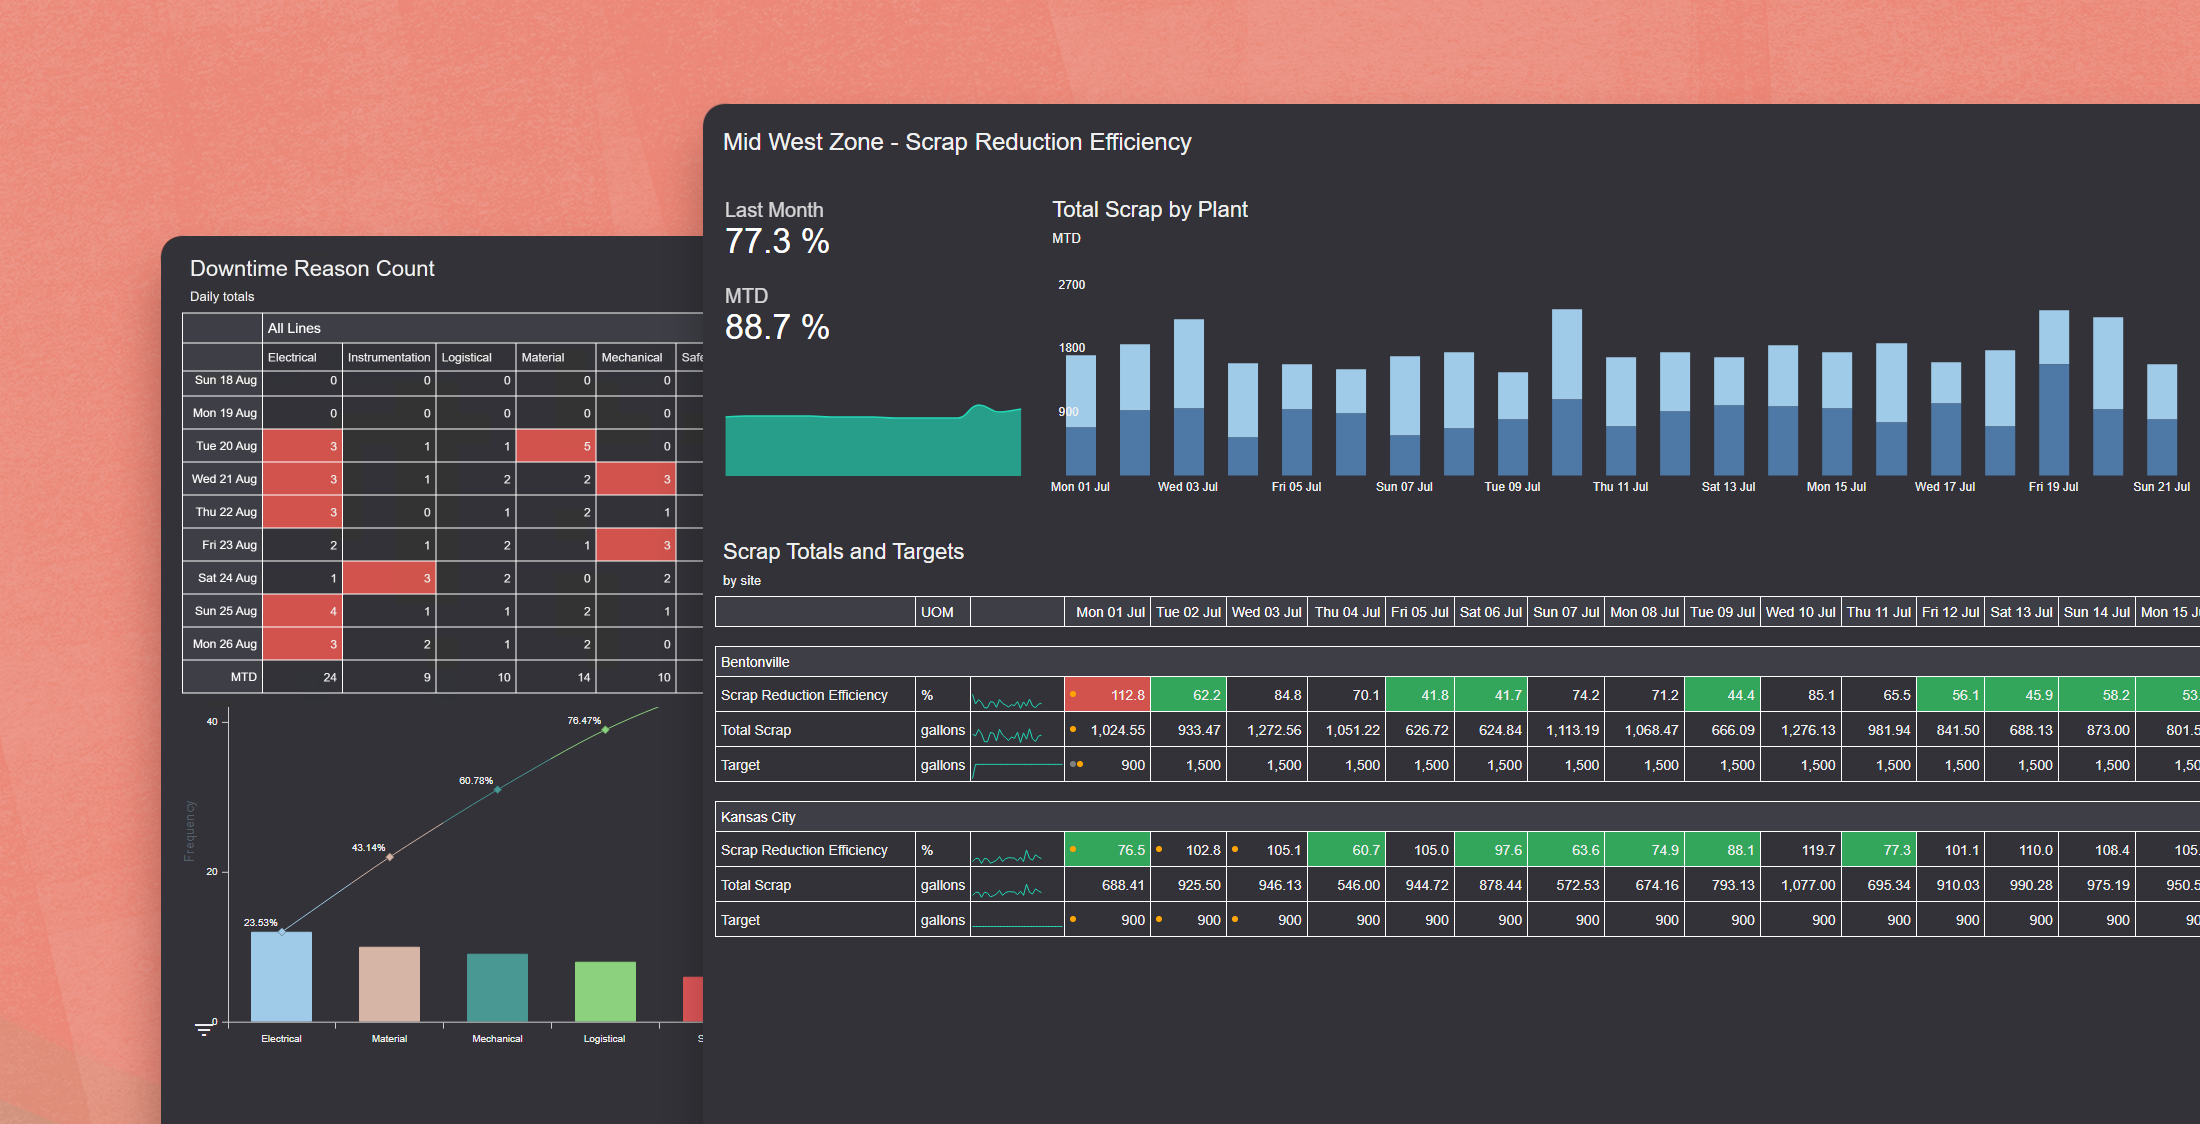
Choose to visualize your data using Flow's included web based dashboards or connect your existing dashboard application to Flow's data feed or API. The choice is yours.
Either way, your decision makers will have information readily available that they can trust when it matters most.

Comments
Add comments to any data and it will be annotated to the original data point.

No User Limits
There is never a licensing restriction on the number of users or dashboards.

Interactive
Investigate any data point, even the expressions and data behind the values.
Step 5: Bridge
Feed Data Lakes, Apps And
Other Systems Automatically
What really sets the Flow Information Hub apart is the ability, and willingness, to freely publish every piece of information we create out to other systems and data warehouses. Nothing you do in Information Hub is held captive, and everything is designed to be securely shared.

On Demand
A single endpoint to query normalized data from many systems.

On Schedule
Push datasets on a calendar period interval like hourly, daily, weekly, etc.

On Trigger
Use specific events to trigger the publication of information or notify your team.

Tiered Servers

REST API

AWS

Snowflake

Azure Event Hub

MySQL

PostgreSQL

MSSQL

MQTT

MQTT Sparkplug

Kafka

Canary Historian


Microsoft Teams

Slack

Plus many more
Meet Your Factory’s New Smartest Hire... AI Gateway Is Here

AI Gateway turns every plant floor question into an answer instantly, intelligently, and in plain language.
It unlocks the full power of Flow's Information Hub by bridging your curated data models with the intelligence of AI, making everyone on your team a data expert. No more skills gap, value from every team member, day one!
This is much more than just an MCP Server, this is 18 custom built tools to ensure your agent is an expert at collaborating with your Flow Information Hub solution.
Schedule a Custom Demo →
Tech Supply Specialist
Governing KPIs across 30+ breweries with InfoHub
AB InBev’s Africa Zone faced a familiar challenge seen across large manufacturing groups. Each brewery operated its own reporting stack. KPIs were defined differently from site to site, and similar metrics often used entirely different formulas. Data lived in spreadsheets, isolated systems and monthly packages that took days to compile. Leadership at the Zone level had no reliable way to compare performance across breweries or roll up utility and production data for broader analysis.
InfoHub became the foundation for solving that problem. Rather than forcing each brewery into a centralised platform, the deployment followed a tiered model. The team started by equipping every site with InfoHub, giving operators and managers a single source of truth for their plant-level KPIs and dashboards. The work eliminated manual duplication and improved confidence in asset performance, energy usage and production KPI calculations.
Once each site had a working model, a governance layer was built at the Zone level. A central template server defined the standardised KPIs, data structures and dashboards that every brewery would reference. Instead of asking people to comply, the system ensured compliance automatically. Every site received the same KPI definitions, the same formulas, and the same event model—no matter which team entered the data or which system the values originated from.
With sites and governance in place, data replication connected breweries to the Zone. Aggregated and event-level KPIs from every plant are now available in near real time, and always structured the same way. For the first time, AB InBev Africa can compare breweries directly, spot outliers immediately and understand the drivers behind high performers. Utility consumption and production calculations can now be rolled up without manual editing. Leaders can evaluate both cost and efficiency at a single site or across the entire region within minutes rather than waiting for month-end spreadsheets.
More than 500 people across the Africa Zone now rely on the system every day. Over 500,000 measures and thousands of operational events, dashboards and forms are actively governed. InfoHub has become part of the operating rhythm of the region, not a side system.
The downstream effect is bigger than Africa. Today, AB InBev’s Africa Zone is the only zone in the company where KPIs are fully standardised. That achievement makes this region the template for the rest of the global organisation. The success has demonstrated that standardised KPIs do not limit individual breweries—they empower them. It is now possible to see operational patterns across geographies, identify where process optimisation will yield the highest return, and build reliable global reporting without forcing every site to rip and replace existing systems.
This case proves that digital transformation at scale does not require a single monolithic software stack. It requires a governed KPI model, consistent definitions and a reliable way to distribute and synchronise those definitions across dozens of operating environments. That is what InfoHub delivered.
If an organisation has multiple sites, varied systems and a desire to compare performance with confidence—not just collect data—InfoHub provides the missing layer. It is the model that turns data into information and information into action, from the plant floor to regional leadership and beyond.